Search, reports & insights
CCTV Analytics Dashboard for Every Camera and Site
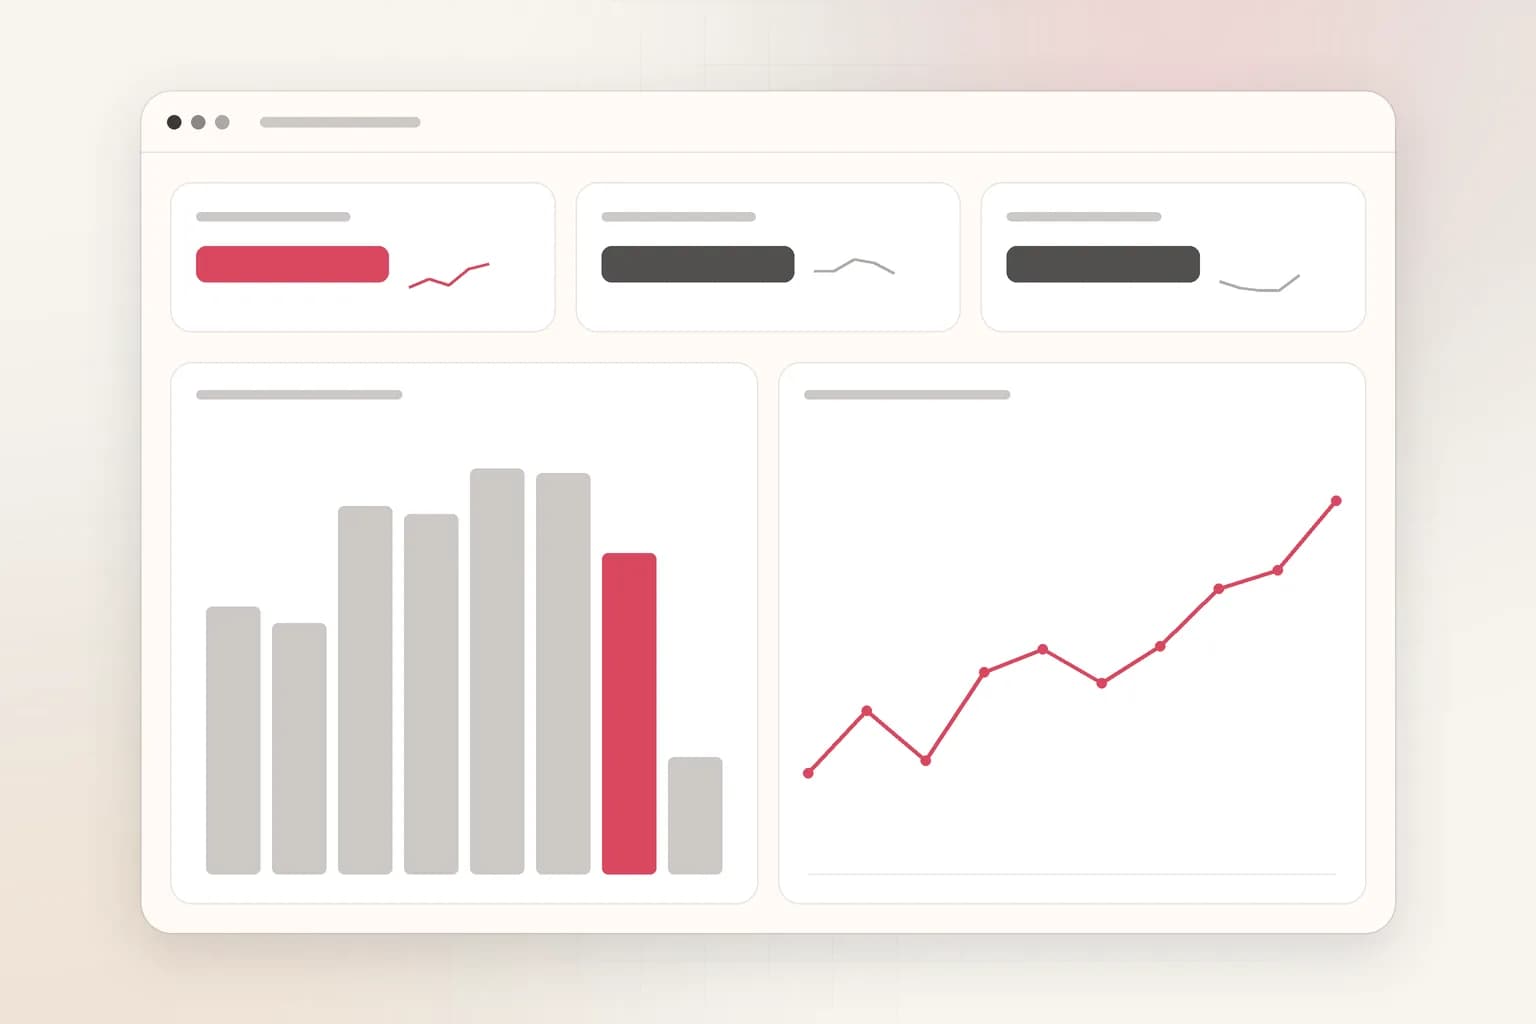
See what's happening across all your cameras in one place: alerts by type, site and hour, which cameras are busiest, and reports per camera. Ask questions of your insights in plain language, or upload footage to analyse it.
Attach a clip and send. The task is filled in; change it to anything you need.
Covers
Every camera and site
Grouped into clusters.
Shows
Alerts and trends
By type, camera and hour.
Export
PDF or Word
For weekly and client reports.
How it works
From a question to an answer in minutes
Upload a clip
For footage you already have: an incident, a shift, a day on site.
- 01Attach a recording (MP4, MOV and most video formats, up to 2 GB) in the box at the top of this page or in a new dashboard chat.
- 02Send the prompt as it is, or change it: “Summarise the activity in this footage hour by hour.”
- 03Get the answer with timestamps and frames, ask follow-ups, and export a report to PDF or Word.
See trends across every camera
Insights shows alerts by type, camera and time, with camera reports and canned questions.
- 01Connect your cameras and turn on the workflows you need.
- 02Open Insights to see alerts by type, camera, site and time of day.
- 03Open a camera report for one camera's history and patterns.
- 04Ask a question about your insights, or export a report to PDF or Word.
What it finds
What CCTV Analytics Dashboard picks up
Alerts over time
Camera reports
Site clusters
Ask your data
Options
Built for real work
- Time window
- Look at a day, a week or longer.
- Clusters
- Group cameras into folders by site or area; drag cameras between them.
- Team access
- Roles for owners, admins, members, operators and viewers.
Every answer
What you get back
- Alert counts by workflow, camera and site
- Busiest hours and days
- Camera reports with history
- Exportable summaries for managers and clients
Use cases
Where teams use it
Compared
Doing it by hand vs. with Ceptory
Without Ceptory
- Alerts scattered across NVRs and apps
- Weekly reports built by hand in spreadsheets
- No view across sites
With Ceptory
- Every camera's alerts in one dashboard
- Reports generated and exported in a click
- Clusters to compare sites
Good results
Tips for accurate results
- Group cameras into clusters by site from day one; it makes every insight easier to read.
Cameras
Works with the cameras you have
Any IP camera or NVR with RTSP or ONVIF, a webcam, or a live stream from OBS, a drone or an encoder. Ceptory Edge runs on a mini PC, NAS or Raspberry Pi on the camera network; nothing is opened to the internet.
FAQ
CCTV Analytics Dashboard: common questions
What does the Ceptory analytics dashboard show?
Alerts from every connected camera by type, camera, site and time, camera reports with each camera's history, and AI insights you can ask questions of. Reports export to PDF or Word.
Does it work across multiple sites?
Yes. Group cameras into clusters by site or area and compare them in one dashboard.
Can my team use it?
Yes. Invite teammates with roles (owner, admin, member, operator, viewer) so each person sees and does what they should.
Is there a mobile app?
Yes. Ceptory for iPhone and Android delivers alerts as push notifications with the frame that triggered each one.
Related
More detection features
Search, reports & insights
CCTV Video Search
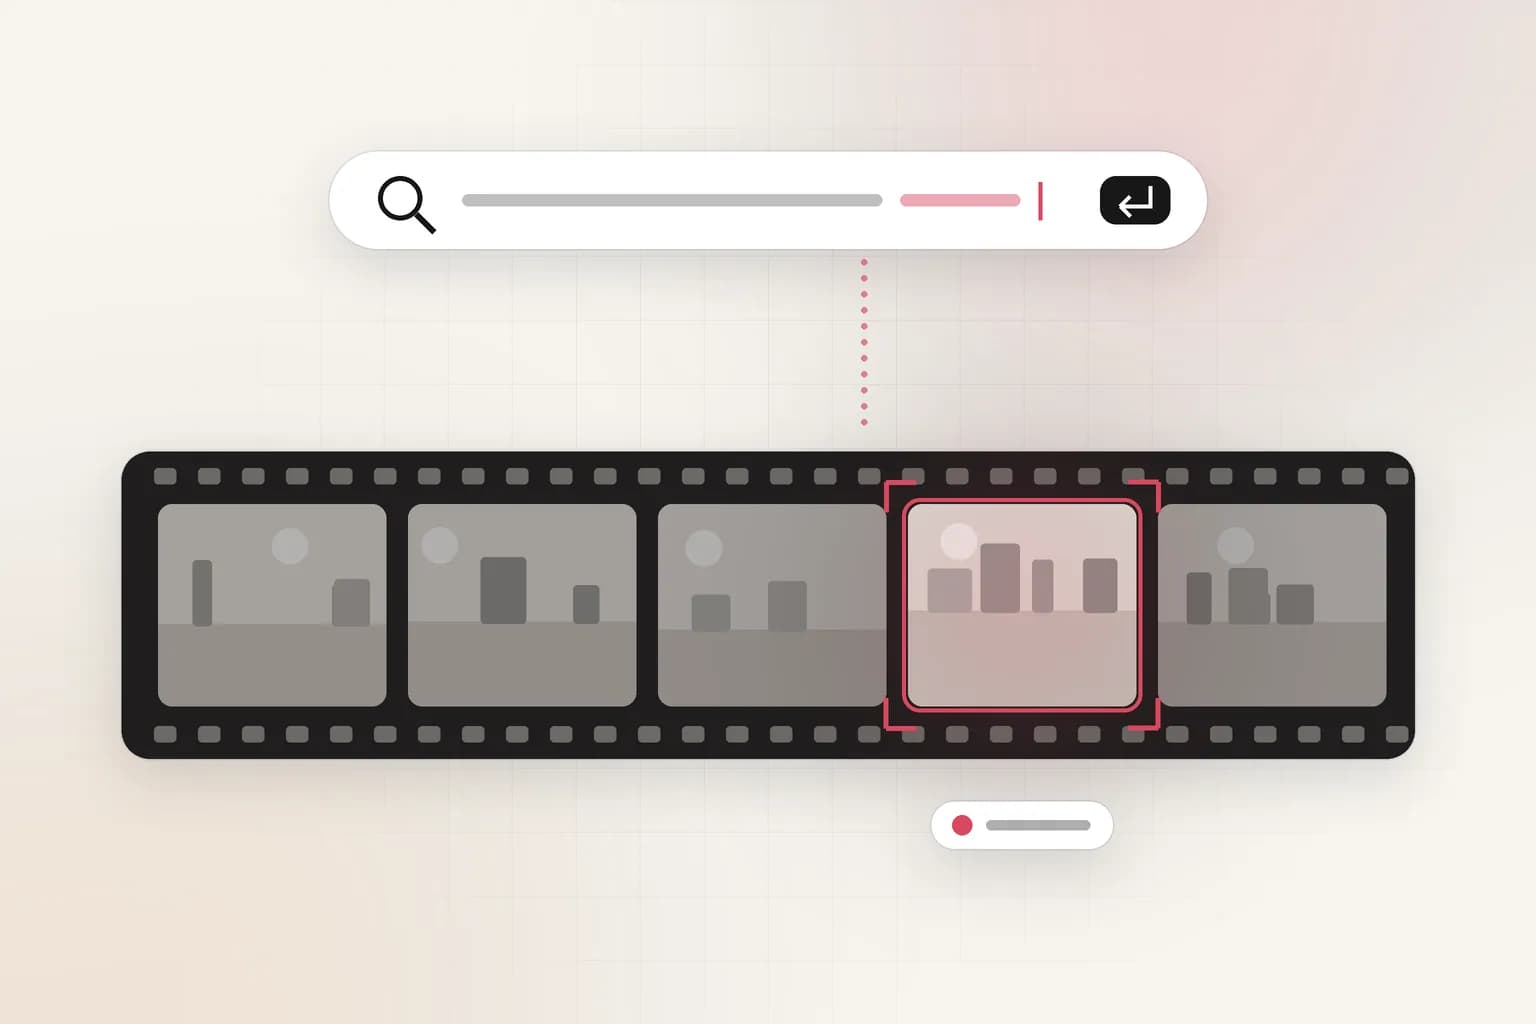
Search CCTV and recorded video in plain English: 'red truck at gate 2 after 10 PM'. Upload a clip or connect cameras and get the exact moments with timestamps.
See the feature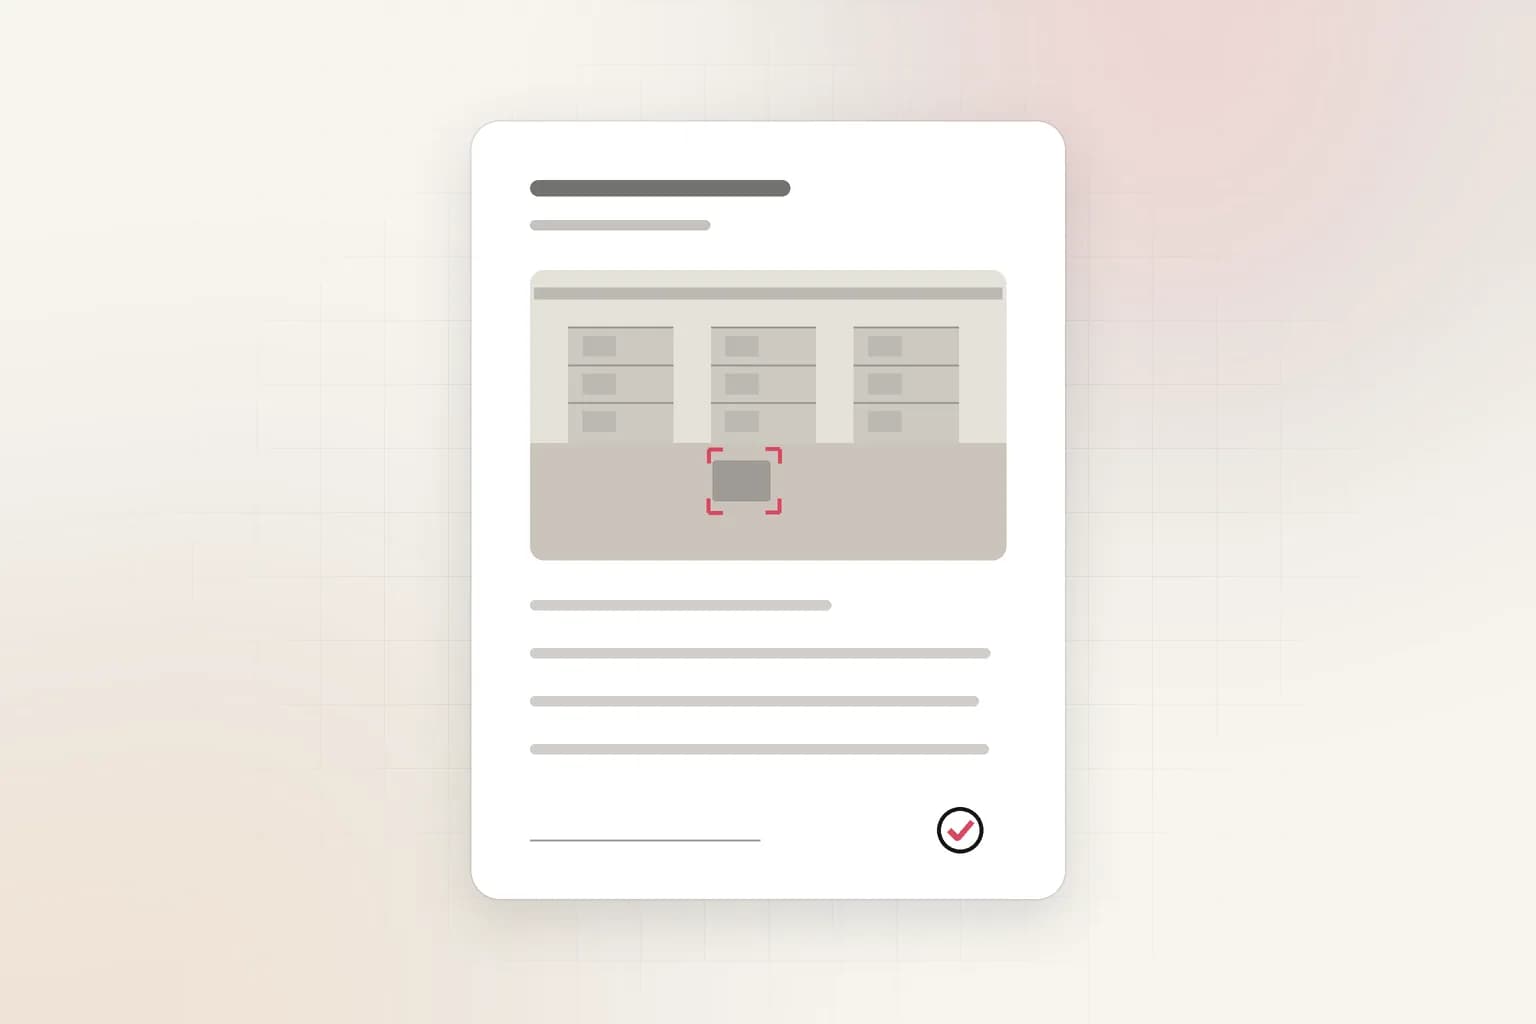
Search, reports & insights
AI Incident Reports
Turn CCTV footage or a camera alert into a complete incident report: AI-drafted timeline, people at the scene, actions taken. Export to PDF or Word in minutes.
See the feature
Security
People Counting & Crowd Limits
Count people on existing CCTV and get an alert when an area is over its limit. Occupancy, crowd and footfall for stores, venues and offices. Try it on a clip.
See the feature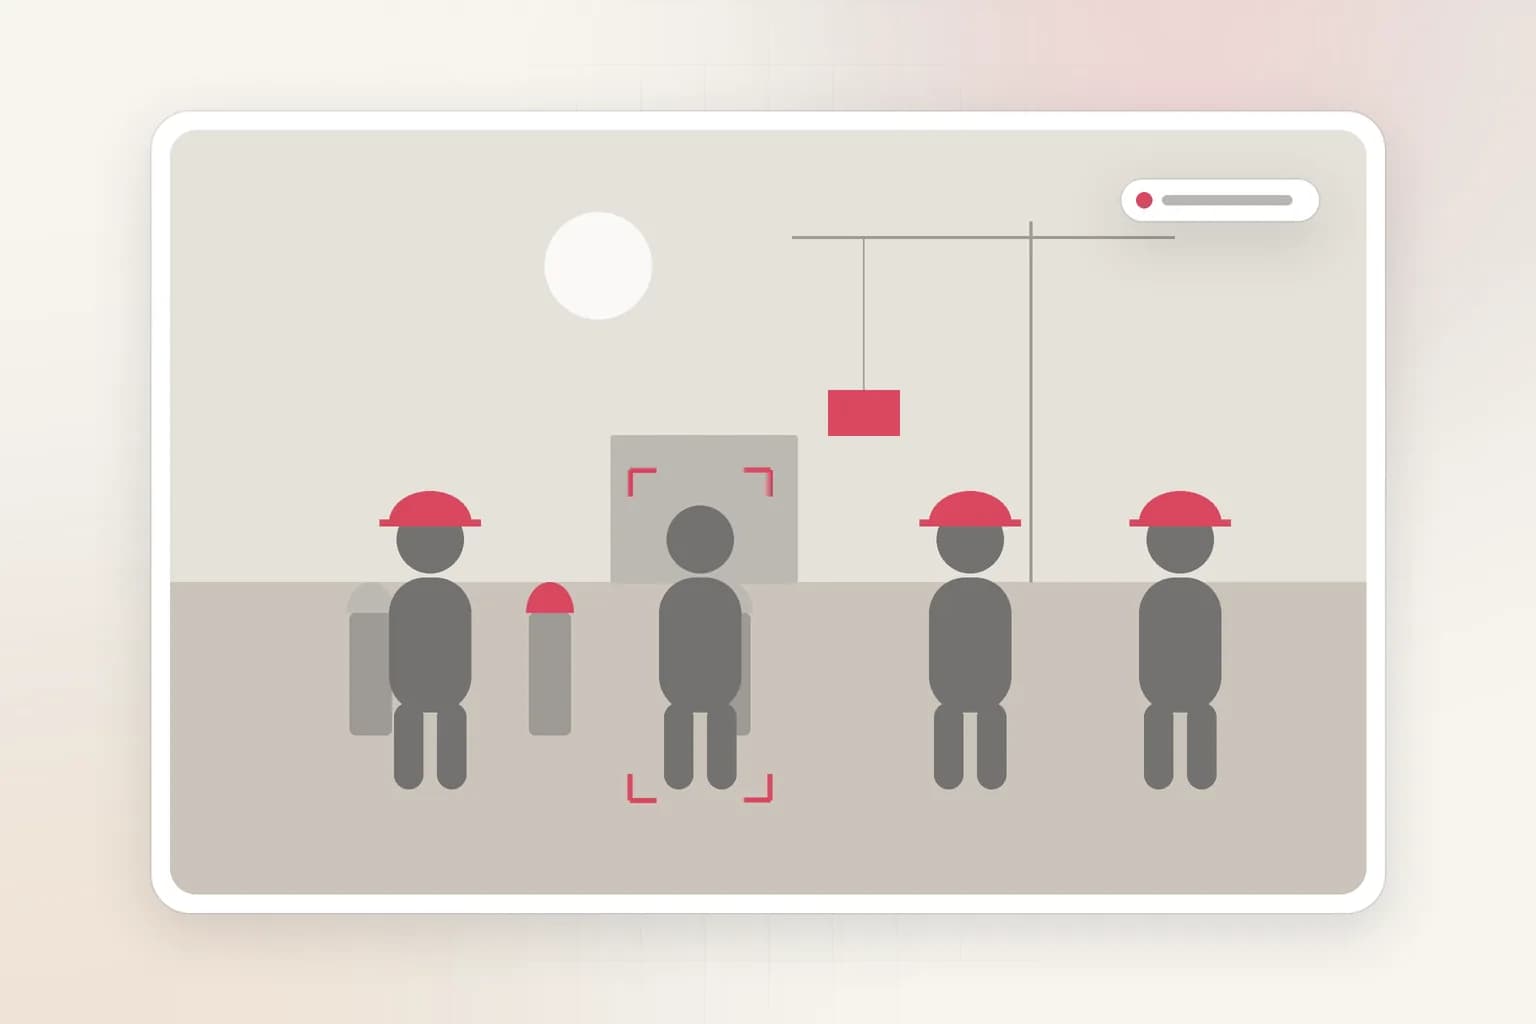
Workplace safety
PPE Detection
AI PPE detection for CCTV and recorded video. Check every worker for a hard hat, hi-vis vest and gloves, get alerts with the frame, and export safety reports.
See the feature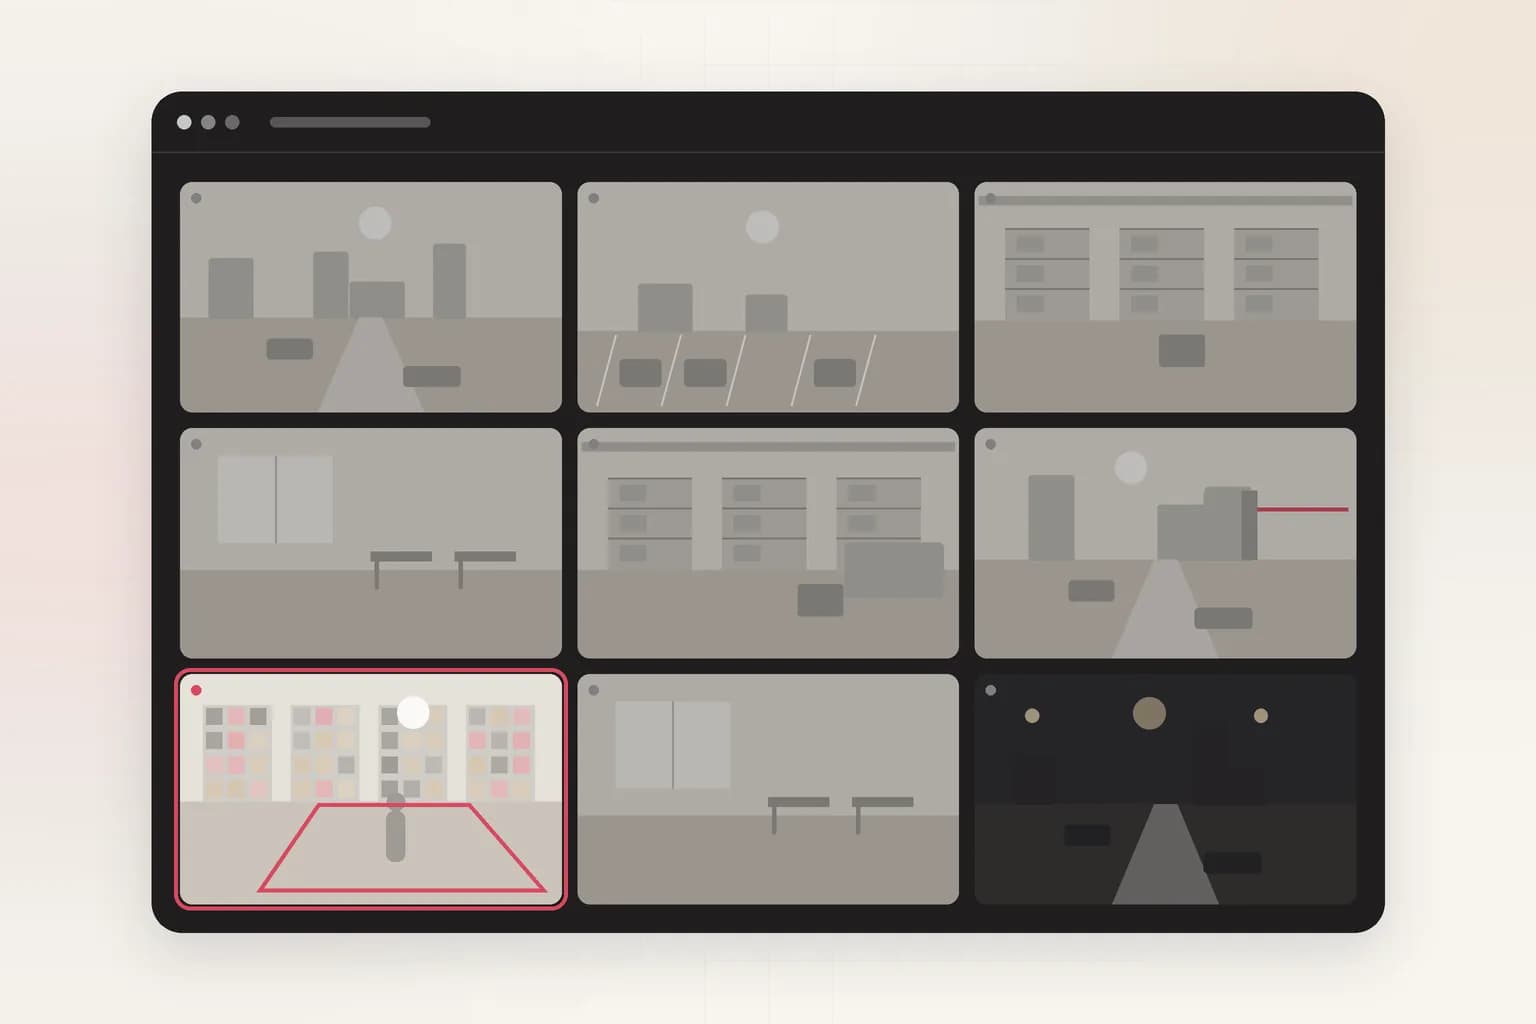
Security
Intrusion Detection
AI intrusion detection for existing cameras: alerts when a person, vehicle or animal enters a restricted area on your schedule, with the frame and clip.
See the featureGet started
Try cctv analytics dashboard on your footage
Free to start. Upload a clip or run it on our example footage before you connect a single camera.